Web Reports

Access real-time statistics from your online surveys with a standalone solution.

01.

Quick and secure access to analyses

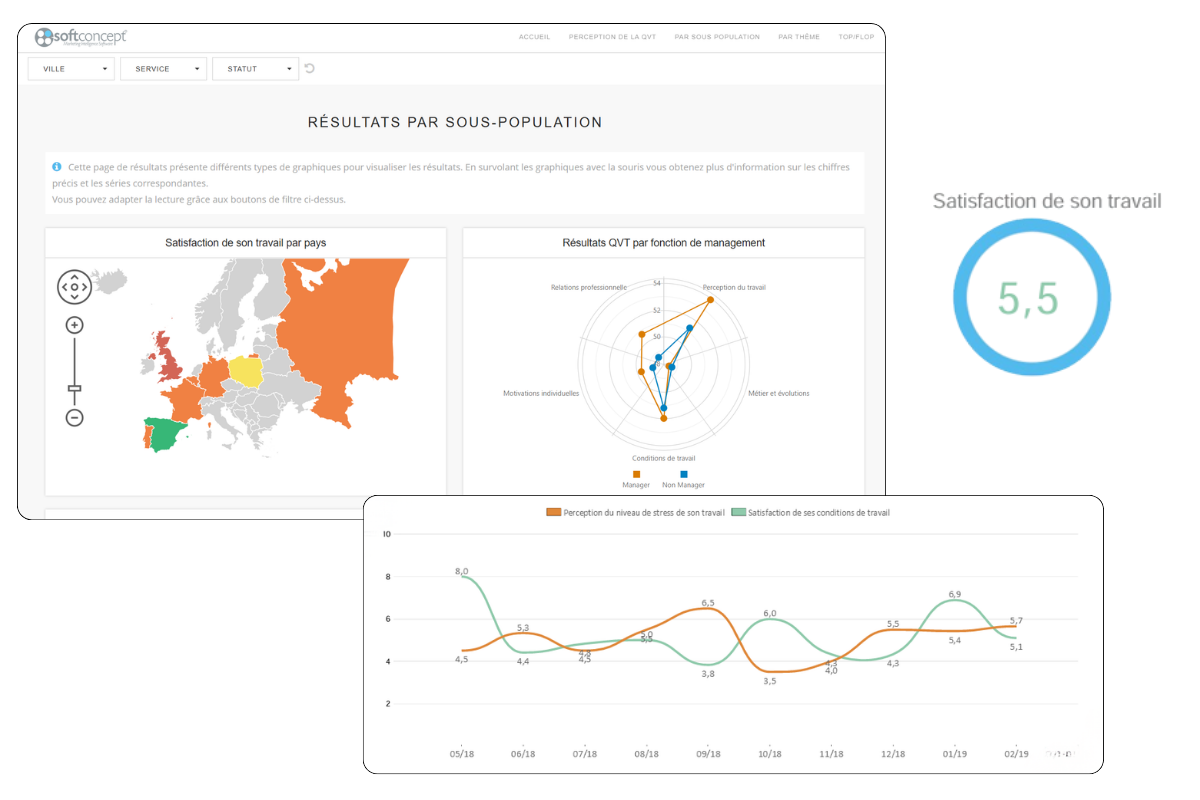
From a simple link, each user accesses an intuitive interface branded with your company's colors.

✓ Secure connection, access filtered according to rights.
✓ Interactive reports: simplified viewing and printing.

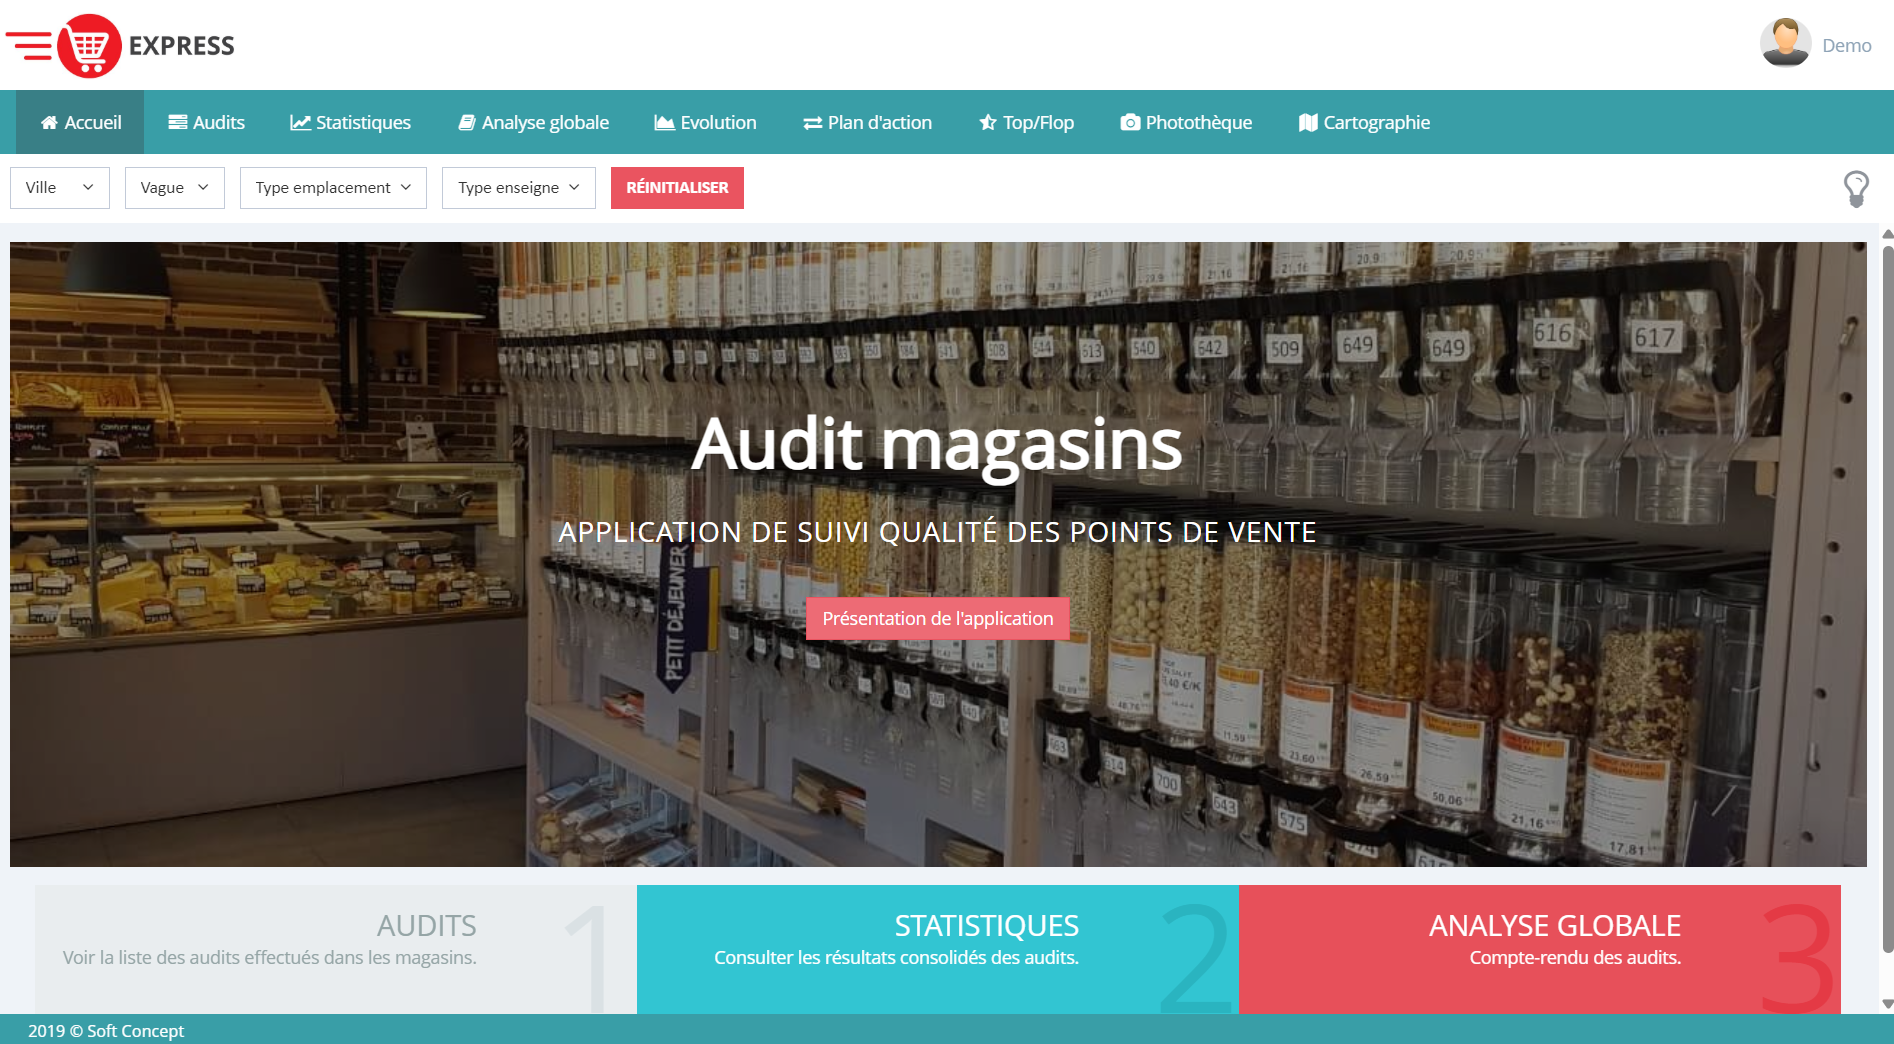
Carte interactive et graphiques d’analyse pour le suivi des données et indicateurs de performance.
02.

Richly illustrated dashboards

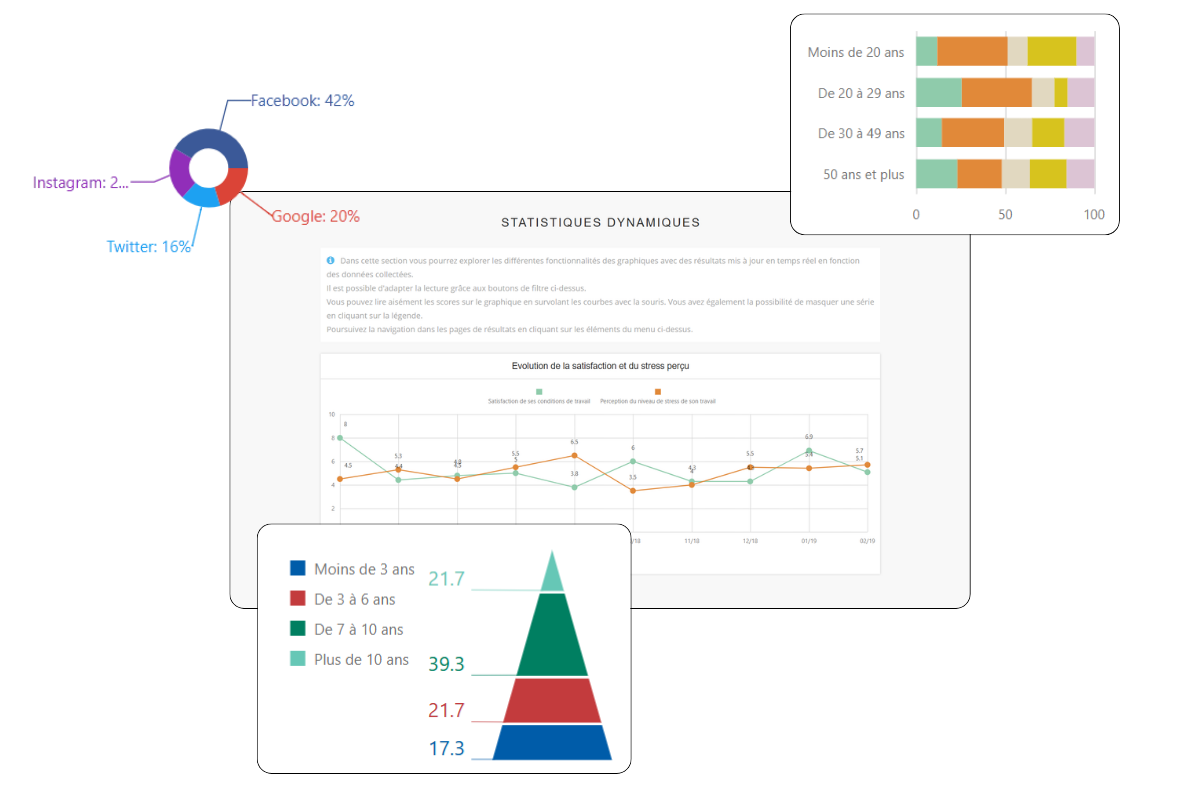
Web Reports provides access to comprehensive reports with interactive tables and graphs.

✓ Data updated automatically.
✓ Results filtered in real time according to the chosen criteria.

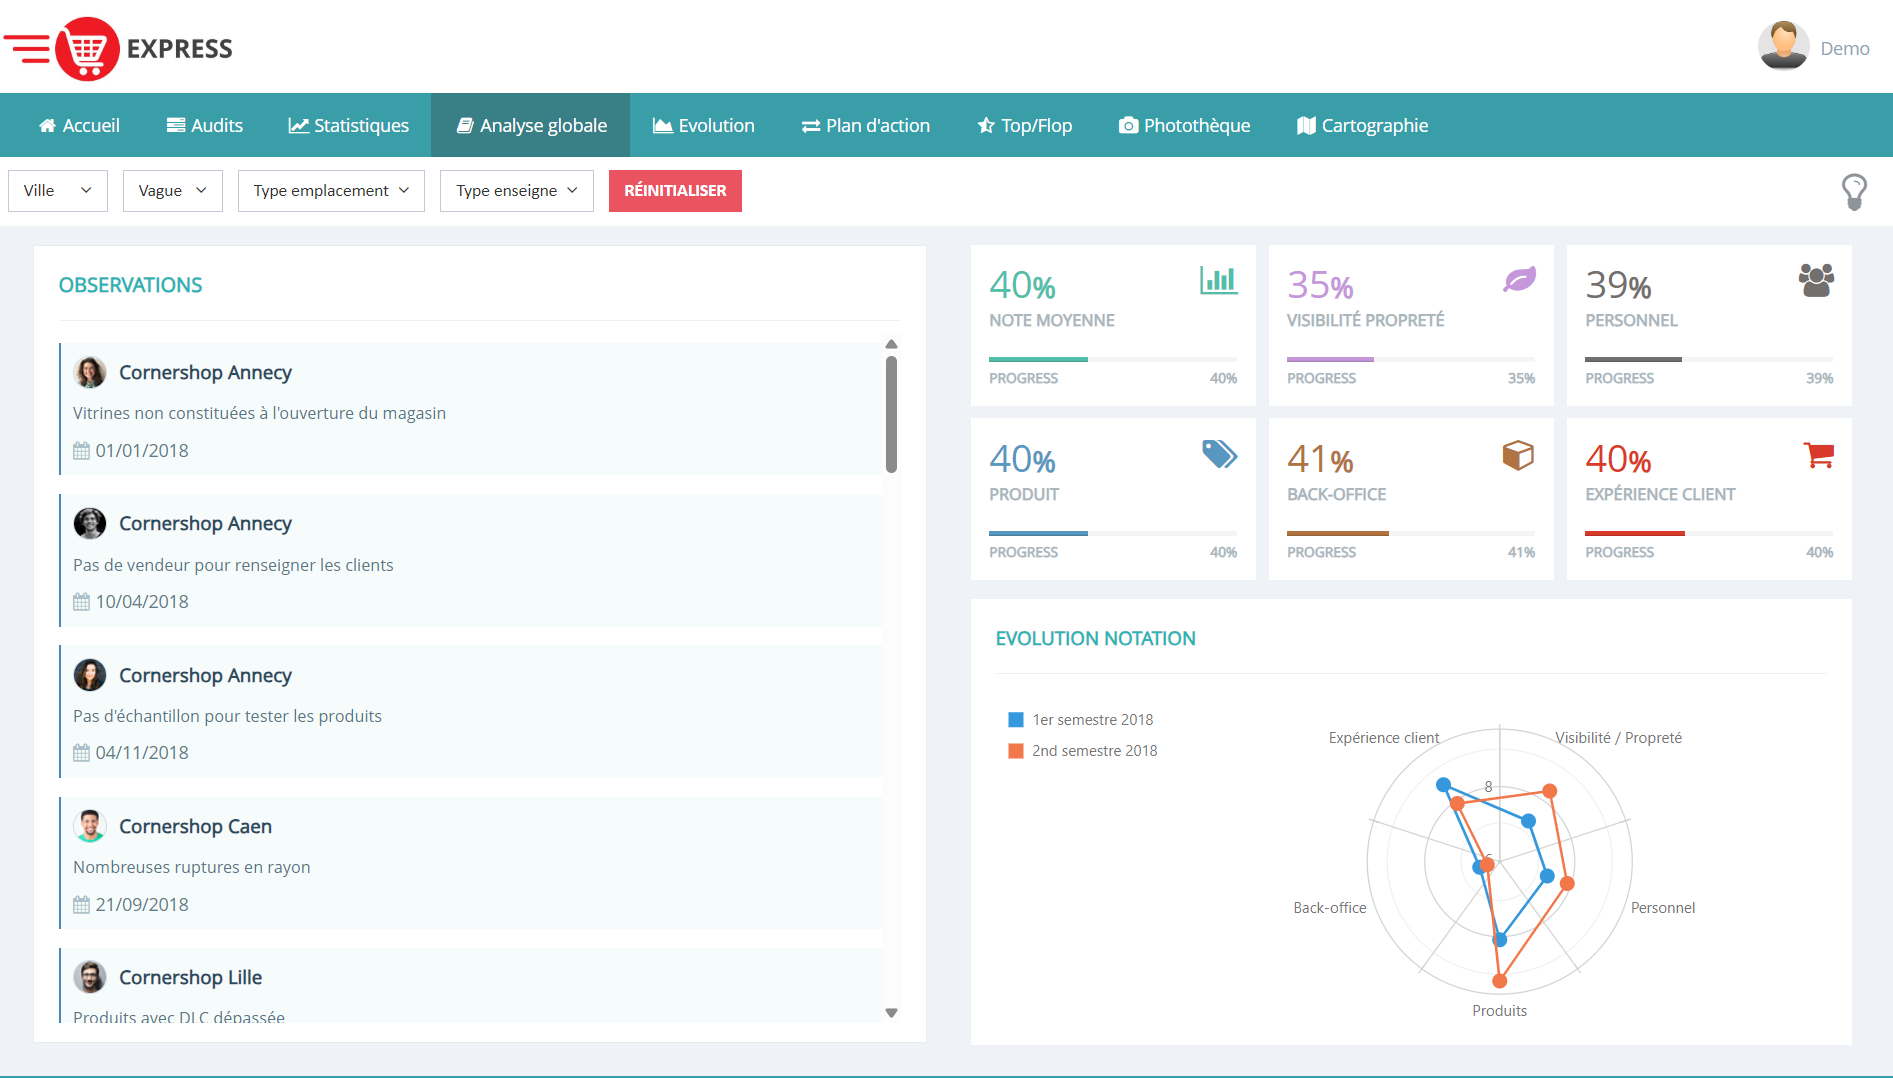
Tableaux de bord statistiques avec graphiques et indicateurs de performance sur interface logicielle.
03.

Total autonomy

Web Reports is a solution sold under a license agreement. One license is sufficient to deploy as many viewing sites as needed, directly on the client's intranet, or on their own website.

Interface web de reporting avec visualisation des résultats d’enquêtes et audits.
04.

Office integration and optimal survey

✓ Compatible with all your sources: Excel, Access, ODBC, CATI, OMR, CAMI, Web…

✓ Advanced analysis with Ethnos, regardless of the collection method.

✓ Enhanced dashboards: images, graphs, sorting, comments, static or dynamic.

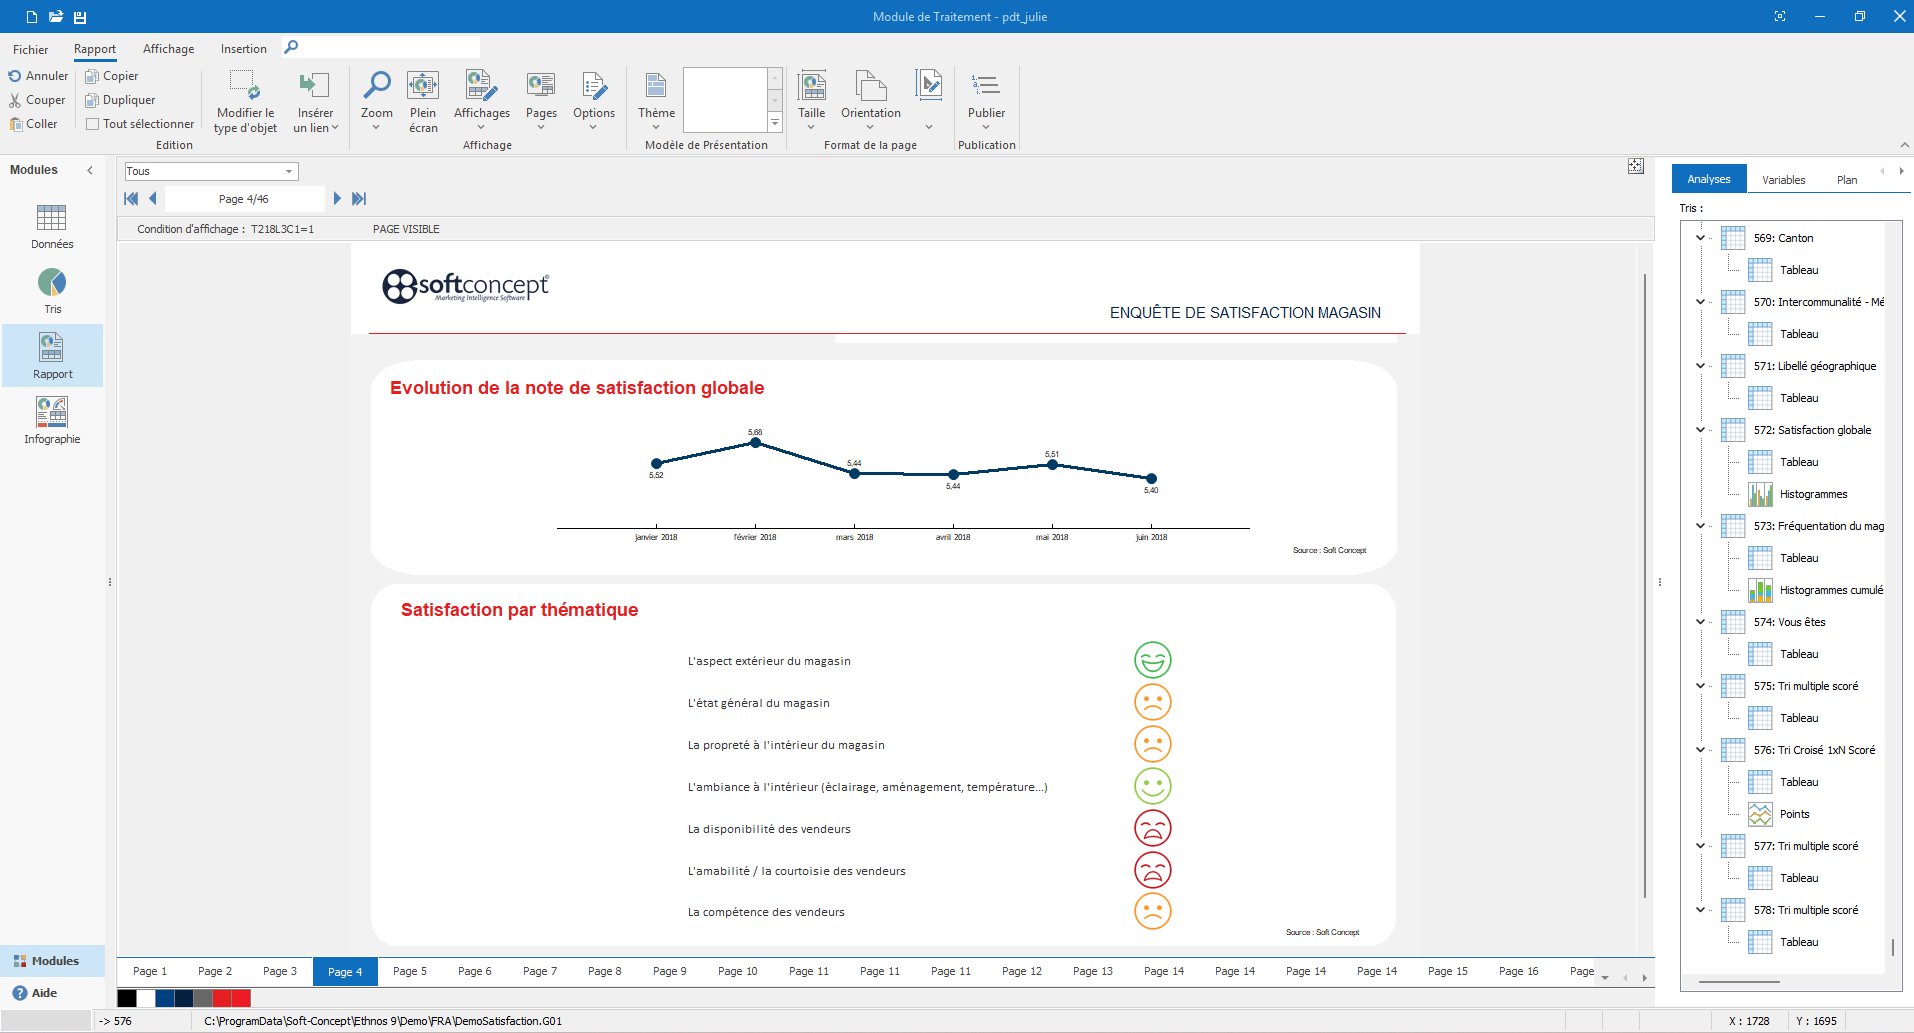
Interface du logiciel Ethnos pour la conception de rapports d’enquêtes.
05.

High added value

Web Reports can be used in the context of quality and satisfaction barometers, for information gathering (budget, store, sector, product…), and offers great potential for high value-added applications.

Tableau de bord web présentant l’analyse des résultats d’enquêtes avec graphiques et indicateurs.
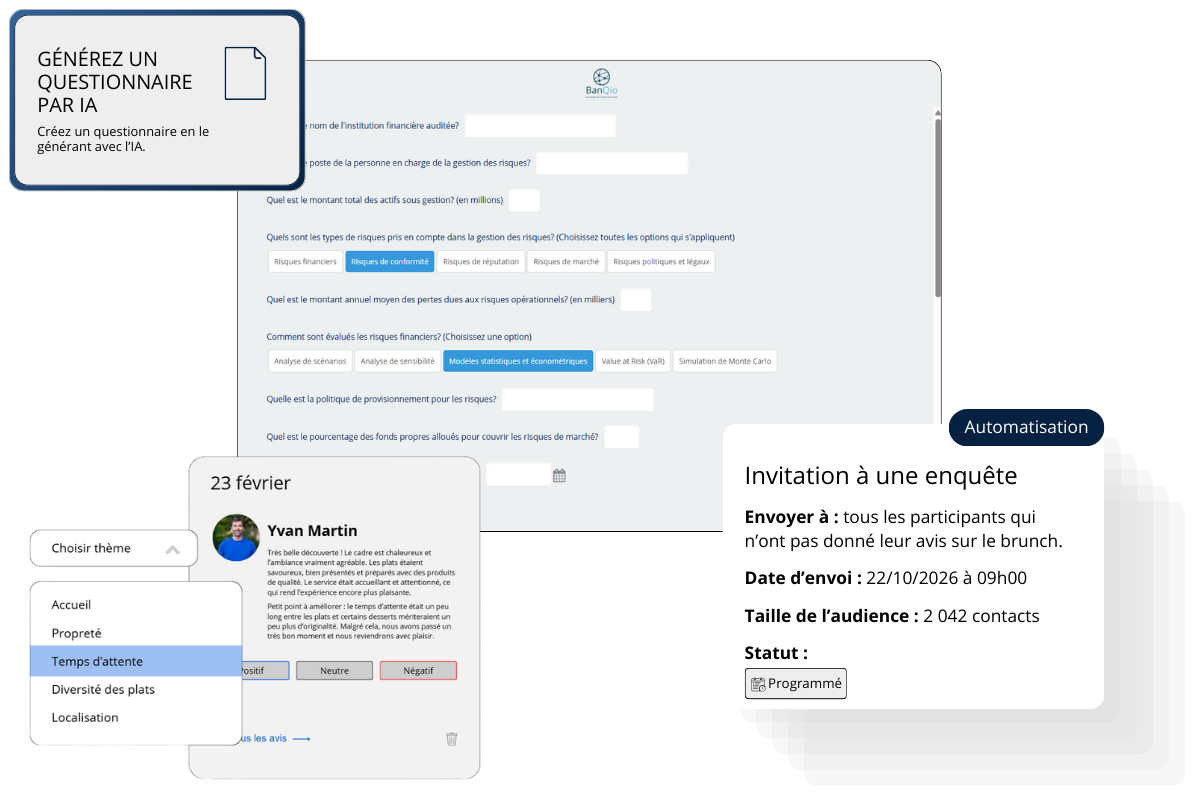
Interface avec intelligence artificielle intégrée à chaque étape de la gestion d’enquête

AI integrated at every stage

The advantages of Web Reports

Dark Image
Quick and secure access to analyses

Through a simple web or intranet link, users access an intuitive interface branded with the company's colors. After logging in, they can securely view their information and view or print customized reports.

Dark Image
Rich and dynamic dashboards

Web Reports offers interactive dashboards that integrate tables and graphs. These tables recalculate instantly based on the applied selection criteria, ensuring that the data is always up-to-date.

Dark Image
Complete autonomy in deployment

Marketed as a license, Web Reports allows you to deploy as many viewing sites as needed, directly on the company's intranet or website, without requiring additional development.

Dark Image
Seamless integration with your tools

Web Reports leverages data from Excel, Access, ODBC, or collection tools such as CATI, OMR, CAPI, and Net-Survey. Dashboards incorporate static elements (images) or dynamic elements (sorting, charts, comments).
FAQ - Web Reports

Do you need to be accompanied?

Organize the training that best suits your company's needs.
Benefit from training funding by your OPCO.

Our training is Qualiopi certified thanks to our partner Digital League.

Image Image Dark

A problem to solve?

Let's discuss your needs to identify the most suitable solution.

Free 14-day trial, no credit card required.

Stay informed!

Subscribe to receive our latest news, announcements and articles.