
Powerful statistical analyses
Access advanced methods to explore your data and identify important relationships.


Quickly identify trends and correlations using advanced statistical analysis.
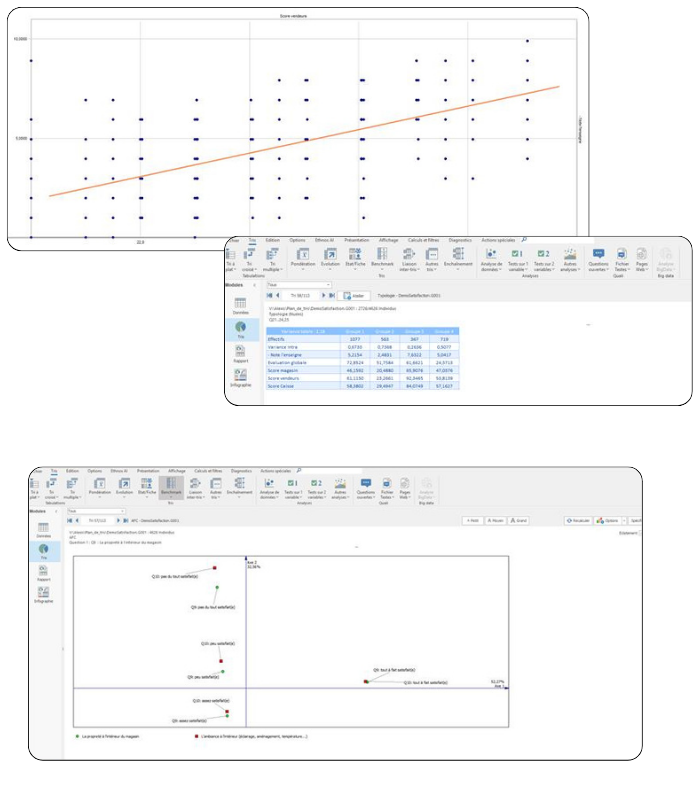
StatMania makes it easy to generate analytical tables and graphs that facilitate the reading and interpretation of results. The collected data is structured to highlight trends, relationships between variables, and key indicators in your studies.
This analytical environment allows for the efficient use of results from surveys or quantitative studies.
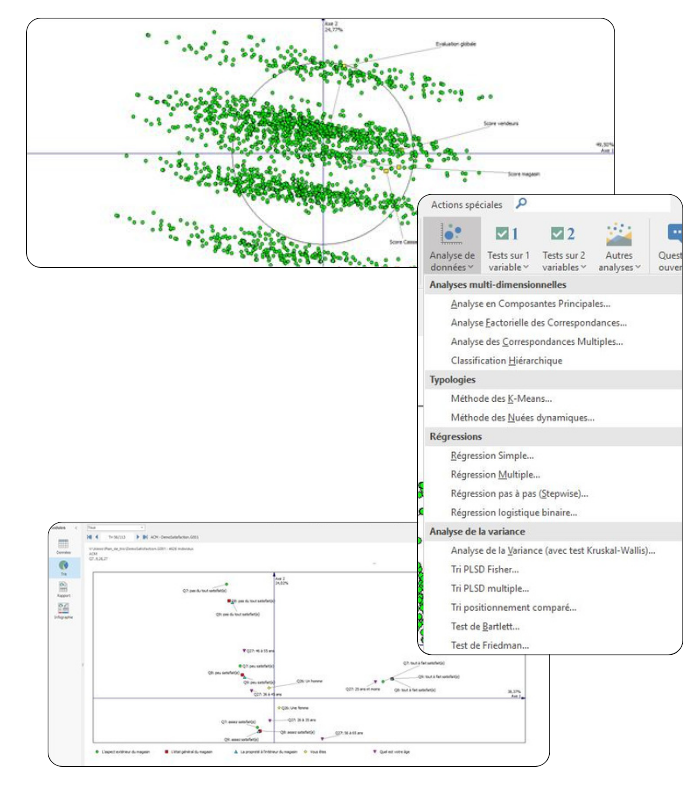
StatMania offers a wide range of statistical methods for in-depth data analysis. These analyses allow you to explore relationships between variables, segment studied populations, and gain a better understanding of observed behaviors.
Among the available analyses:
✓ PCA (Principal Component Analysis)
✓ AFC (Correspondence Factor Analysis)
✓ MCA (Multiple Correspondence Analysis)
✓ Typologies (K-means, dynamic clusters)
The software also allows for advanced analyses to identify significant relationships between variables and to better structure the results of a study.
✓ Available features:
✓ Hierarchical classifications (HCA / HCA)
✓ Simple, multiple, and logistic regressions
✓ Analysis of variance and cross-tabulations
✓ Importance-Satisfaction Analysis (Tetraclass)
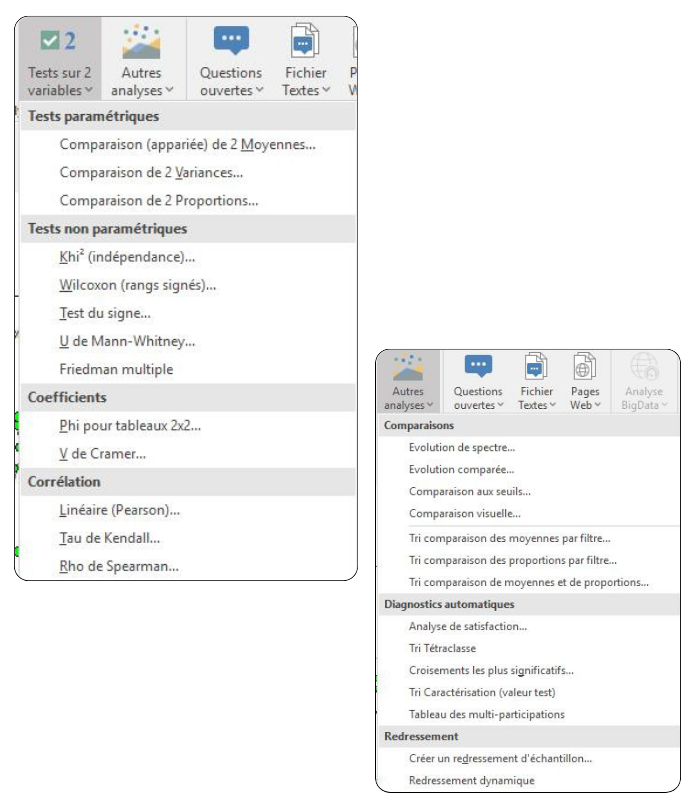
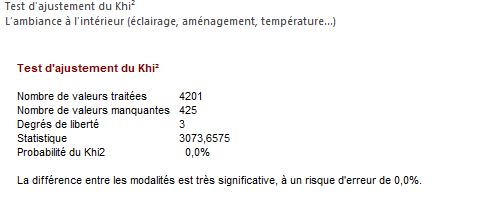
StatMania also incorporates statistical tests to verify the validity of the results and to confirm the relationships observed in the data.
The software offers tests:
✓ Parametric
✓ Non-parametric
✓ On several variables simultaneously
These analyses help ensure the robustness of the conclusions drawn from your studies.
Access advanced methods to explore your data and identify important relationships.
Stat'Mania is a statistical analysis software that allows you to exploit and interpret data from surveys or studies.
It allows for advanced statistical analyses to be performed in order to identify trends and relationships between variables.
The software offers analyses such as PCA, CA, MCA, regressions, hierarchical classifications and analysis of variance.
Yes, Stat'Mania allows you to generate tables and graphs to facilitate the interpretation of results.
The software is aimed at analysts, researchers, research institutes and companies wishing to analyze their survey data.
Organize the training that best suits your company's needs.
Benefit from training funding by your OPCO.
Our training is Qualiopi certified thanks to our partner Digital League.
Discover all our software.
Let's discuss your needs to identify the most suitable solution.
Free 14-day trial, no credit card required.
Subscribe to receive our latest news, announcements and articles.
Collect data where it originates and transform it into high-impact decisions with Soft Concept solutions.